Evaluating LLM Observability Tools for Agent Pipelines
Understand what separates LLM monitoring from agent observability.
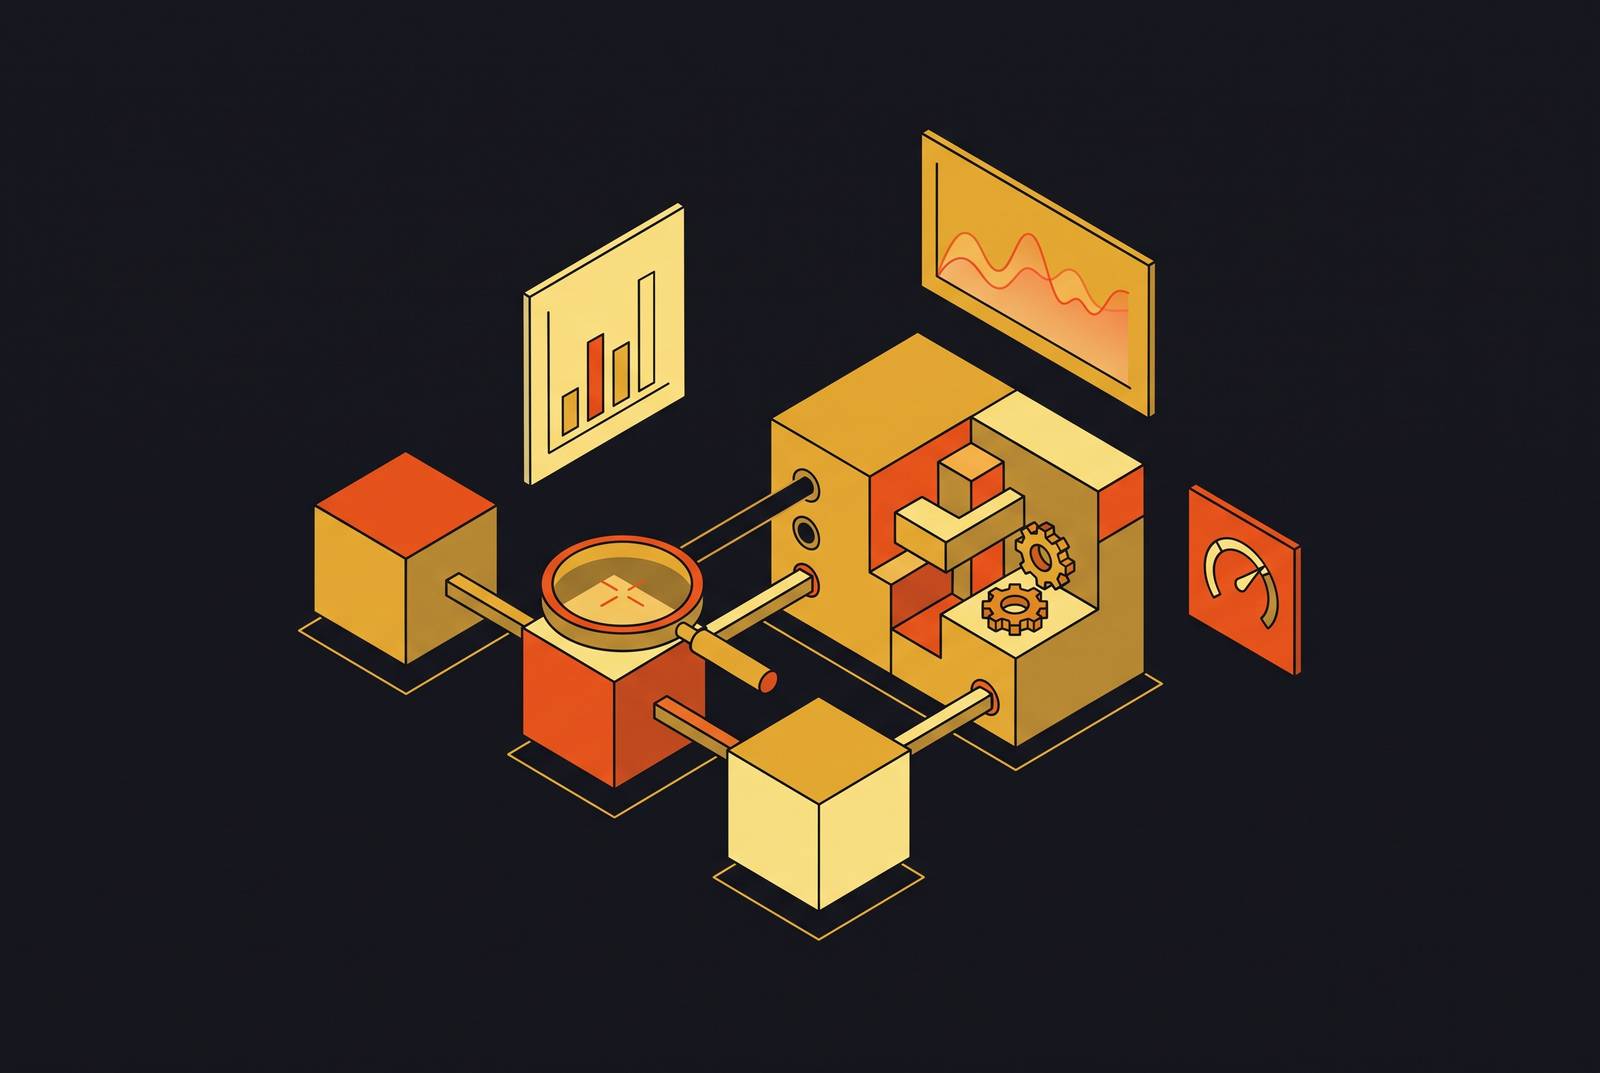
A production agent returns an HTTP 200. Latency looks normal, the infrastructure dashboard is green, and the answer handed to the user is wrong, hallucinated, or built on a tool call that should never have fired. This is the core problem in evaluating observability tools for agent pipelines: a single user request can chain multiple LLM calls, tool invocations, vector lookups, and handoffs between agents, and each of those steps is a place where things can go wrong without tripping a single infrastructure alert. The break is structural. A response can carry a hallucinated answer, a wrong tool selection, or retrieval quality that has quietly degraded, and none of those failures look like a crash or a timeout to the systems built to catch crashes and timeouts.
Traditional application performance monitoring was built for deterministic HTTP paths. Agent pipelines fail quietly: a hallucination doesn't throw an exception, a drifting context window doesn't return a 4xx, and a misrouted tool call completes successfully even when it was the wrong tool to call. These failures appear downstream, as a customer complaint or a bad business decision made on a wrong answer, long after the system that produced them reported itself healthy.
This is why you need to evaluate a tool for LLM correctness separately from a tool for agent observability: both matter, and teams routinely confuse the two. If you treat those as the same question, you can ship a system that passes every test and still fails its users daily. Each additional agent is another handoff, another place causality can get lost, and another reason the old monitoring playbook doesn't apply.
What makes agent observability structurally different from LLM monitoring
Agent observability isn't an expanded version of single-call LLM monitoring with more dashboards bolted on. It needs a different data model, one built around causal chains that span multiple steps, so isolated request-response pairs won't do. If a tool logs each LLM call cleanly but can't connect those calls into a single traceable thread, it has solved a smaller problem than the one agent pipelines present.
The unit that matters changes too. Agentic systems tend to fail between calls, in a tool invocation that returned the wrong format, in a retry that masked a deeper issue, in a handoff where one agent passed incomplete context to the next. Request-level logging renders all of that as a flat list with no sense of sequence or cause.
Evaluation itself has to become part of that trace, not a separate process run after the fact. An agent can retrieve a passage that scores high on semantic similarity to the query and still get the answer wrong, because the source was outdated or contextually off, so retrieval quality and generation quality need separate traces.
The practical consequence: a tool that only confirms the system is running has done half the job. If it cannot score the quality of output on live traffic, the most consequential failure mode an agent pipeline produces stays invisible to it. Any checklist for comparing these tools has to come from these structural properties of agent systems, not from the kind of feature list an APM vendor would recognize.
The evaluation criteria that map to agent pipeline complexity
Comparing tools without first fixing the criteria is how two platforms that solve genuinely different problems end up looking interchangeable on a feature sheet. The criteria below follow directly from the structural properties described above, not from a generic observability checklist.
Tracing granularity across the full causal chain comes first, because everything else depends on it. A platform needs to capture every step of an agent's reasoning loop, meaning LLM calls, tool calls, retrieved documents, reranking decisions, intermediate outputs, and handoffs between agents, as one connected trace. A waterfall view that shows what ran when, what blocked what, and where latency built up across a run is the baseline capability here. Sequence diagrams and topology views for multi-agent handoffs separate the tools built for this problem from the ones adapted to it.
Inline evaluation on live production traffic is the second criterion, and it's the one most likely to get skipped. A platform needs to score outputs for faithfulness, relevance, hallucination, and safety on live traffic, not only inside offline test runs before release. Tracing without evaluation is expensive logging: it shows latency and token counts while leaving the question of whether the output was actually correct unanswered. The test here is concrete. Can evaluators be configured at the span, trace, or session level, and do the same evaluators used before release also run against production traffic?
Retrieval-step visibility is the third criterion, and for RAG pipelines specifically, it decides whether debugging is fast or slow. Without that, a bad answer forces a guessing game between four causes that all look identical from the outside: weak retrieval, poor ranking, missing context, or drift in the generation step itself.
Production-grade alerting on quality, not just infrastructure, is the fourth criterion. A platform needs to alert on regressions in faithfulness, relevance, or policy compliance, not only on crashes, timeouts, or rate-limit errors. Real-time, threshold-based alerting on quality metrics is the semantic-layer equivalent of an uptime alert, and a tool without it leaves a team finding out about quality drift from customers.
A tool needs to instrument LangChain, LlamaIndex, custom orchestration code, and multiple model providers without locking a team into one ecosystem, and its support for OpenTelemetry and OpenInference decides whether agent telemetry can flow into infrastructure a team already runs, like Datadog, Grafana, or New Relic, rather than demanding a second, parallel stack.
Cross-functional access without engineering gatekeeping is the sixth criterion: product managers, QA engineers, and subject-matter experts need to be able to review traces, annotate outputs, and leave feedback without routing every question through an engineer first.
Cloud, in-VPC, and on-premise deployment options gate adoption for regulated industries and for any pipeline handling sensitive B2B data, and this is non-negotiable for a meaningful share of enterprise buyers.
How the leading tools perform against these criteria
Open-source and self-hosted tracing tools make up one category. Langfuse is an open-source LLM engineering platform covering observability, tracing, evals, and prompt management, available self-hosted or cloud-hosted. It captures full pipeline traces, integrates with RAGAS for automated metric calculation on sampled traces, and surfaces latency, cost, and quality trends in its dashboards, backed by strong community adoption and full data ownership for teams that self-host. Its gaps sit in online evaluation depth, which depends on the RAGAS integration rather than being native, and in governance and runtime enforcement, which fall outside its scope.
Arize Phoenix, source-available under the Elastic License 2.0 and built on OpenTelemetry standards, provides detailed tracing for prompts, model responses, retrieval pipelines, and agent workflows, with built-in hallucination detection and an embeddings visualizer for cluster and retrieval analysis (full embedding drift monitoring belongs to the separate Arize AX product, not Phoenix itself). OpenObserve unifies LLM observability with full infrastructure monitoring, logs, metrics, traces, and frontend telemetry, in a single self-hosted, OpenTelemetry-native, AGPL-3.0 licensed deployment. It accepts OTLP traces from LangChain, LlamaIndex, or any OTel-instrumented framework and runs continuous LLM-as-judge scoring at the span, trace, or session level, which makes it a standout option for AI and DevOps teams that want one platform instead of a separate monitoring stack for infrastructure alongside the LLM layer.
All-in-one evaluation and observability platforms form a second category. LangWatch combines monitoring, evaluation, and experimentation in one OpenTelemetry-native platform with full GenAI spec support, capturing multi-step LLM and agent workflows from any framework or language with no proxy sitting in the request path. Pricing is free up to 200,000 events per month, then it starts at €29 per seat per month beyond that. Confident AI standardizes evaluation, observability, red teaming, and governance across product teams and technology stacks, with a free plan and flat-rate paid tiers starting at $200 per month plus usage-based overage at $1 per GB-month for trace spans, and it's suited to enterprises trying to standardize evaluation practice across several teams at once.
Enterprise APM integration is a third category. Datadog LLM Observability extends Datadog's existing APM platform to LLM and agent workloads, with a free tier and paid plans from $160 per month for the Pro tier, including 100,000 LLM spans. New Relic plays a similar role for teams with an existing APM investment there.
OTel-native standards layers make up a fourth category. Traceloop, built on OpenLLMetry, feeds OpenTelemetry-based LLM telemetry into existing backends like Datadog or Grafana, auto-instrumenting a wide range of LLM providers, vector databases, and agent frameworks while tracking distributed traces, token usage, response times, and request flows in real time. Grafana Cloud suits teams building observability around OpenTelemetry and customizable dashboards, particularly those with an existing Grafana investment.
A final category covers agent-specific and governance-first platforms, each strong in a particular lane: Lyzr Opencontroller connects observability to evaluation, governance, deployment, identity, and runtime control, wiring visibility directly into what agents are permitted to do. Arize AI (distinct from Phoenix) covers broader ML and AI observability, including drift, embeddings, and production model monitoring.
The retrieval layer is the blind spot most observability stacks still miss
Most of the tools above instrument the LLM call and the agent orchestration layer well. The web retrieval step is where most of them stop looking, treated as a black box that returns text without anyone checking what happened on the way there, leaving a team unable to tell a generation failure from a retrieval failure when an answer comes back wrong.
For agents that ground their reasoning in live web data, retrieval is where a distinct class of failure starts. A traditional SERP API returns metadata snippets of limited length, too thin for production RAG or agent synthesis, which forces the pipeline to fetch each URL separately: executing JavaScript, stripping boilerplate HTML, and extracting structured text as a second step bolted onto the first. Aggregator-style providers add a further risk: stale links or cached snippets from pages that no longer exist inject hallucinated context before the LLM has done anything wrong.
Agent pipelines depend on retrieval quality as much as reasoning quality, and a vector search that returns something semantically close to the query but outdated or factually wrong will degrade the final answer in a way traditional monitoring cannot see. Seltz is one such service: it's built as a Web Knowledge API that delivers context-engineered, machine-ready content through an owned, end-to-end pipeline, not a chain of scraping steps bolted together after the fact.
If the retrieval layer isn't instrumented as its own span, capturing the query, the source, the content returned, freshness signals, and a quality score, the trace has no way to separate "the LLM hallucinated from good context" from "the LLM reasoned correctly over bad context," which is why the architecture of the web search API an agent relies on matters to observability and not only to retrieval quality. Built-in model browsing, by contrast, returns no stable schema, hiding retrieval from evaluation.
Enterprise requirements that cut across every tool decision: data privacy, PII handling, and audit trails
Observability doubles as a data exposure surface in an enterprise LLM stack, and the right tool has to manage that tension. An observability platform that can't enforce that inline creates a compliance liability for any team operating in a regulated industry, regardless of how good its tracing otherwise is.
Compliance frameworks are turning these expectations into formal requirements. Both the EU AI Act and the NIST AI RMF Generative AI Profile raise documented expectations around monitoring, and for regulated industries, a RAG architecture needs full audit trails of retrieval decisions along with explainable source citations attached to every response. When you assess retrieval instrumentation, check whether the tool distinguishes retrieval-layer failures from generation-layer failures, and whether it connects to web knowledge infrastructure that keeps retrieved context both semantically sound and grounded in live web data, not a cached index or a training-data snapshot.
Running the evaluation in practice: a decision process for engineering teams
Applying the framework above in the right order matters as much as having it, because the goal is to eliminate options before comparing features, not to score every tool against every criterion and tally the result.
Start by fixing the non-negotiables: deployment model (cloud, in-VPC, or on-premise), data residency and PII handling requirements, and whatever observability infrastructure already exists, including OTel compatibility and any current investment in Datadog or Grafana.
Stress-test the retrieval layer specifically. Send a known retrieval failure through the pipeline, a stale source, a 403, a mis-parsed page, and check whether the resulting trace shows which retrieval step failed, what it returned, and how that fed into the generation step, independent of whether the final output happened to look wrong.
Finally, audit the alerting model. Confirm that alerts fire on quality regressions, drops in faithfulness, rising hallucination rates, degrading context precision, and not only on infrastructure failures. An alert that only fires on a timeout misses the entire category of failure that matters most in an agent system.
A retrieval layer built from the start for AI instrumentation, with typed results, an owned pipeline, and a stable schema, is easier to observe than a scraping stack assembled from fragile parts, and that difference reduces how many blind spots remain at evaluation time and raises how reliable the traces are when a production incident needs debugging. If teams treat this evaluation as an architectural decision made before deployment, they end up with systems they can actually debug. Teams that add observability after the first production incident are left reconstructing, after the fact, a trace their tooling was never built to produce.